
Currency Pairs: Any
Timeframes: Any
Minimum Deposit: Any
Recommended Account Type: ECN or Raw Spread
Leverage: From 1:30 to 1:1000
Recommend broker: Roboforex
Recommend Vps: GoVPSFX
DeltaProfile TimePrice Bjorgum Levels is a multifunctional indicator for TradingView, written in Pine Script version 5, which combines three key tools: Delta Flow Profile (LuxAlgo), Estimated Time At Price (Kioseff Trading) and Bjorgum Key Levels. It is designed to analyze money flows, time at price levels and key support/resistance zones, providing traders with a deep understanding of market dynamics.
Key Features
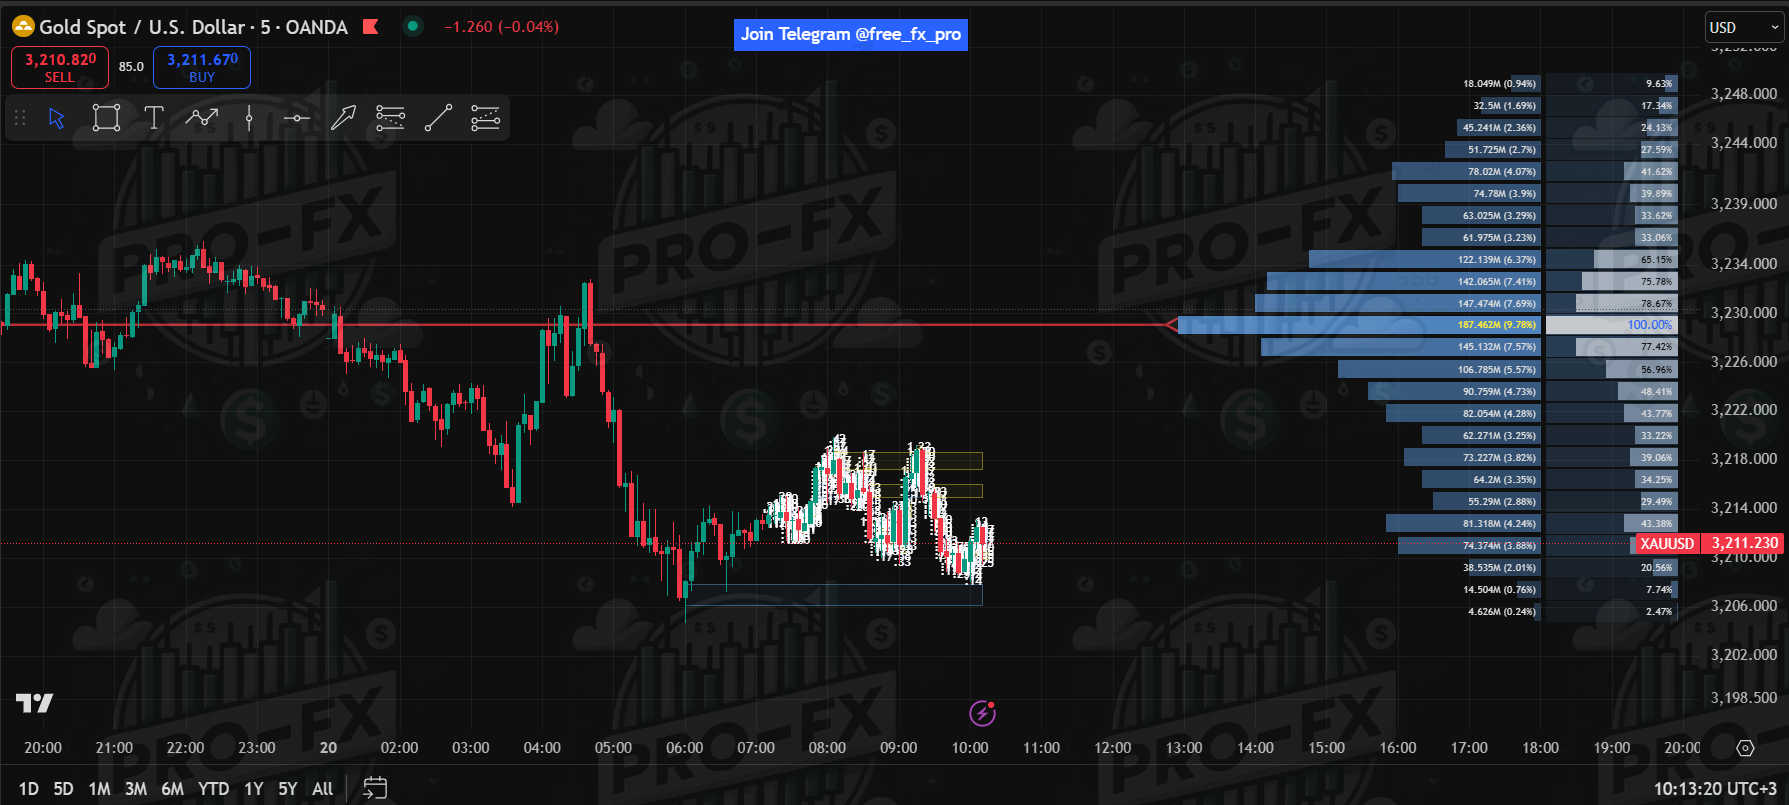
1. Delta Flow Profile (LuxAlgo):
– Money Flow Profile: Displays the total money flow (purchases and sales) for a given period at certain price levels. The length of the series shows the volume of money flow.
– Normalized Profile: Normalizes the data, presenting the length of the levels as a percentage of the maximum level for easy comparison.
– Delta Profile: Shows delta (difference between buy and sell) and dominant side at price levels.
– Polarity Method: Two calculation methods: Bar Polarity (close > open for bullish, close ≤ open for bearish) and Bar Buying/Selling Pressure (analysis of distances from close to high/low).
– Level of Significance: Highlights price levels with the most money flow (Developing, Level, Row).
– Settings: Lookback Length (default 360 bars), Number of Rows (25), Profile Width (17%), colors and text sizes.
2. Estimated Time At Price (Kioseff Trading):
– Time at Price: Calculates the time the price spends at certain levels using data from lower timeframes (1 minute).
– Calculation modes: Percentage (recommended, 0.25% step) or ticks (default 50 ticks).
– Classic Look: Divides bars into rows (default 10) for visualization.
– Highest Time Lines (POC): Displays the levels with the longest time, with the option to hide when violated or far from the price.
– Settings: Enables options to display lines, labels, fonts (Default/Monospace), colors (Up/Buy, Down/Sell, POC).
3. Bjorgum Key Levels:
– Pivot Zones: Determines key support and resistance levels based on pivot high/low using ATR (default 30 bars, multiplier 0.5).
– Candle Patterns: Detects candlestick patterns (Doji, Engulfing, Hammers, Tweezers, etc.) with filters (e.g. body size, shadows, ATR).
– Breakouts/False Breaks: Identifies breakouts (Breakout/Breakdown), false breakouts, and moves off support/resistance.
– TSI Curl: Uses the TSI indicator to identify momentum changes at key levels.
– Settings: Look Left/Right (20/15 bars), Number of Pivots (4), candlestick pattern filters, colors (bullish/bearish zones, patterns, breakouts).


Reviews
There are no reviews yet.