Currency Pairs: Any
Timeframes: Any
Minimum Deposit: Any
Recommended Account Type: ECN & Cents
Leverage: From 1:30 to 1:2000
Recommend broker: Roboforex
Recommend Vps: GoVPSFX
Do you want to automatically receive an 85-90% auto-rebate on every trade and earn much more from trading? Look here
Do you want to earn automatically and stably 20-25%/month with safe DD? Look here
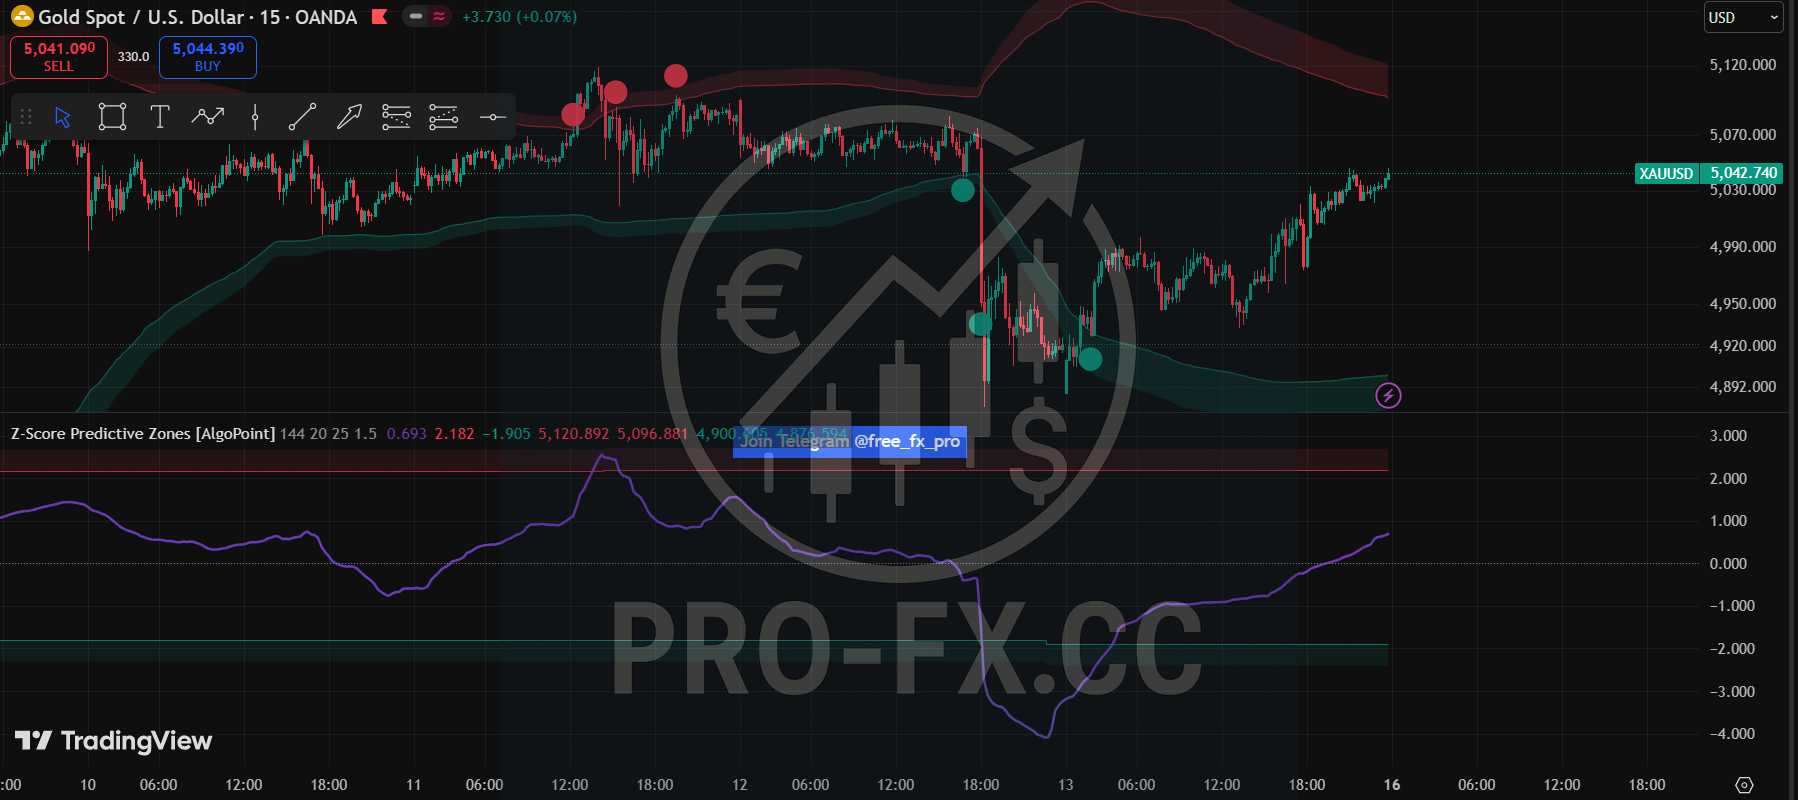
Z-Score Predictive Zones is a professional statistical trading tool designed to identify overbought and oversold conditions with high precision. Unlike standard oscillators that use fixed levels, this indicator uses adaptive statistical analysis to calculate where an asset is likely to reverse based on its unique historical volatility.
Key Features
Statistical Mean Reversion: The indicator calculates the Z-Score (the number of standard deviations price is from its mean) to determine how “stretched” the market is. It uses a smoothed VWMA (Volume Weighted Moving Average) to filter out market noise.
Dynamic Adaptive Zones: Instead of using a static level like 70/30, this script looks back at a specific number of previous reversals (Lookback Depth) and calculates an average reversal level. This creates dynamic support and resistance zones that evolve with market conditions.
Price-Oscillator Integration: The indicator performs “reverse engineering” to project the statistical zones from the oscillator pane directly onto the main price chart. This allows you to see exactly where the price needs to touch to trigger a statistical reversal.
RSI Gradient Sentiment: The Z-Score line features a dynamic color gradient powered by an EMA-smoothed RSI, providing an extra layer of trend sentiment (Bullish, Bearish, or Neutral) at a glance.
Automated Signal Dots: When the price enters these high-probability predictive zones, signal dots are plotted on the chart to highlight potential entry or exit points for mean-reversion trades.
How It Works
Oscillator Pane: Monitor the Z-Score line. When it hits the red (Resistance) or green (Support) background zones, the market is at a historical statistical extreme.
Main Chart Overlay: Watch the price bands. These bands represent the “Average Resistance” and “Average Support” converted into price values.
The Signal: Look for the Circle Labels on your candles. These appear when the high or low of a bar penetrates the predictive zones, suggesting a high-probability reversal is imminent.


Reviews
There are no reviews yet.