

Currency Pairs: Any
Timeframes: Any
Minimum Deposit: Any
Recommended Account Type: ECN or Raw Spread
Leverage: From 1:30 to 1:1000
Recommend broker: Roboforex
Recommend Vps: GoVPSFX
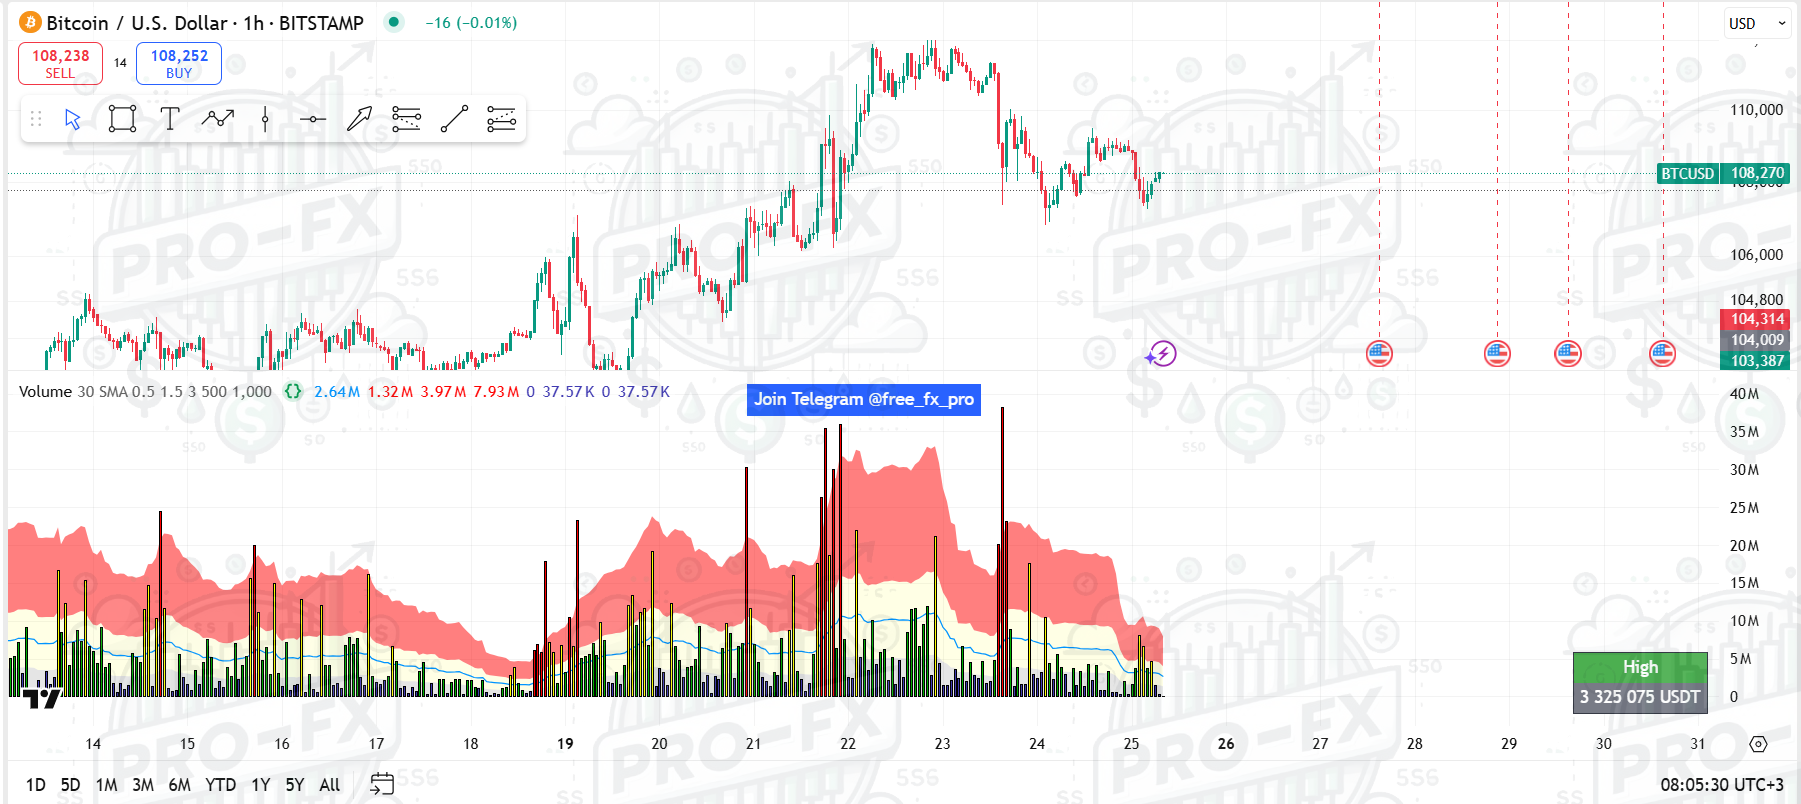
Volume Spread Analysis Custom is a TradingView indicator written in Pine Script version 5, designed to analyze trading volumes in combination with price (Dollar Volume). The indicator displays volumes in a histogram format, using moving averages (SMA/EMA) to determine market activity levels, and also provides information on the liquidity of the asset. It does not overlay the chart (overlay=false) and is displayed in a separate area.
Main Features
1. Dollar Volume Analysis:
– Calculates the volume in dollars as the product of the volume (volume) and the closing price (close).
– Allows you to visualize market activity through a histogram, where the color of the bars depends on the volume level relative to the moving averages.
2. Moving Averages:
– The main moving average (MA0) with a custom length (default 30) and type (SMA or EMA).
– Additional levels (MA1, MA2, MA3) as MA0 multipliers (0.5x, 1.5x, 3.0x) that set thresholds for volume classification.
– Color indication: blue (MA0), red (MA1–MA3).
3. Color classification of volumes:
– If Dollar Volume is below MA1 — dark blue (Navy).
– Between MA1 and MA2 — green (Green).
– Between MA2 and MA3 — yellow (Yellow).
– Above MA3 — red (Red).
– Alternative mode: green (#26a69a) for price growth, red (#ef5350) for decline (if Color Analysis is disabled).
4. Background fill:
– Separates areas of low (black background), medium (yellow background) and high (red background) volume for clarity.
5. Liquidity Analysis:
– Calculates the median volume for a given period (default 500 candles) and converts it to USDT (volume * closing price).
– Compares the median volume with the liquidity threshold (position size * 10, default $1000 * 10 = $10000).
– Displays the liquidity status in a table: “Low” (red) or “High” (green), with the value in USDT.
6. Additional Features:
– Number formatting with a separator (e.g. 1,234,567 USDT).
– Table with a Telegram link (@free_fx_pro) to contact the community.
Trading Application
– Timeframes: Suitable for any TF, but it is better to use on M15 and higher for more accurate volume analysis.
– Assets: Effective for Forex, cryptocurrencies (e.g. BTC/USDT) and other instruments with high liquidity.
– Strategy:
– Red volumes (above MA3) may indicate potential reversals or strong moves.
– Green and dark blue volumes are accumulation or low activity zones.
– Low liquidity (“Low”) may signal slippage risks with large positions.
Advantages
– Easy to interpret thanks to the color scheme.
– A useful tool for assessing market liquidity and activity.
– Flexible settings (MA length, type, multipliers, liquidity period).
Disadvantages
– Does not take into account the spread, which may be important for VSA (Volume Spread Analysis).
– May be less effective in low-liquidity markets.


Reviews
There are no reviews yet.