

Currency Pairs: Any
Timeframes: Any
Minimum Deposit: Any
Recommended Account Type: ECN or Raw Spread
Leverage: From 1:30 to 1:1000
Recommend broker: Roboforex
Recommend Vps: GoVPSFX
Do you want to automatically receive an 85-90% auto-rebate on every trade and earn much more from trading? Look here
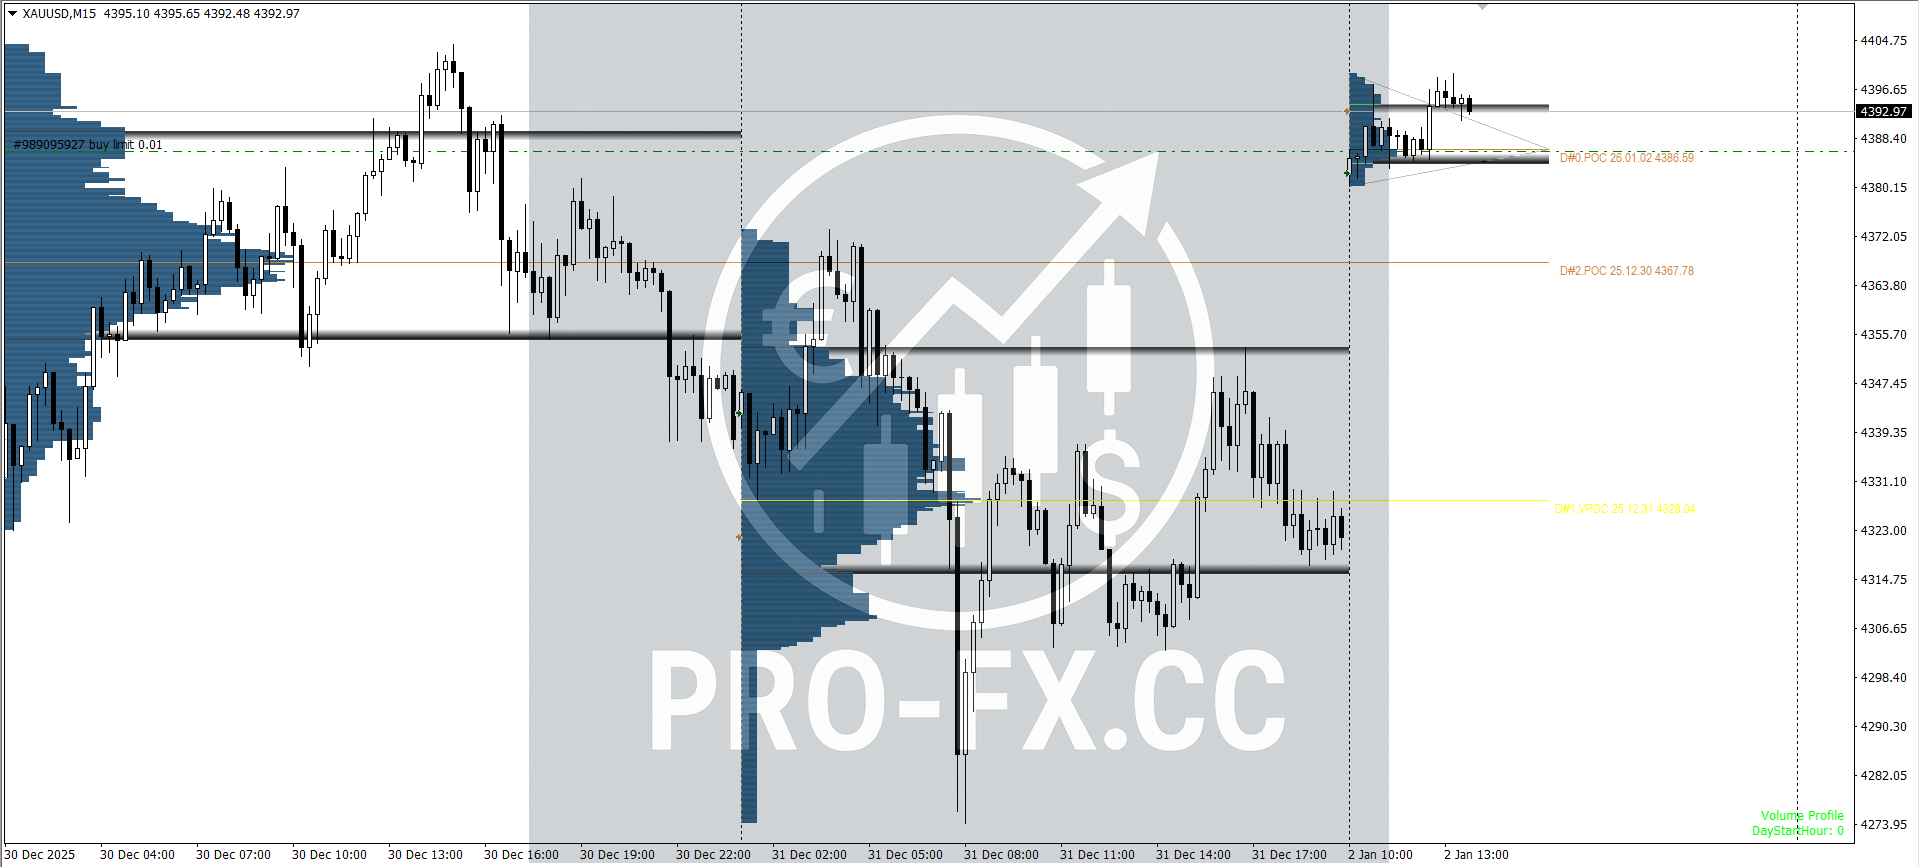
Marketprofile-trend-lines-indicator MT4 this indicator is designed to visualize the Market Profile and plot trend lines based on volume analysis. It helps identify key support and resistance levels, value areas, and price points of control (POCs), as well as track the opening and closing dynamics of trading sessions.
Specific trading setups (strategies):
Setup 1: Breakout of the Value Area (main)
Signal: Price consolidates within the daily VA.
Trigger: A strong candle (preferably on increased volume) closes above the VAH (for a long position).
Entry: On a retracement (pullback) to the VAH, which has now become support.
Stop-loss: Below the midpoint of the VA or below the VAL.
Take-profit: At the level of previous extremes or at the next HVN/POC on a higher timeframe.
Setup 2: Bounce from the POC/VA boundary within the trend
Context: There is a clear uptrend (a series of higher lows, the indicator trendline is pointing upward).
Signal: Price correction (pullback) to the daily POC or VAL.
Trigger: The appearance of a reversal candlestick pattern (pin bar, engulfing) at the POC/VAL level.
Entry: On a breakout of the high of the trigger candle.
Stop-loss: Beyond the opposite VA boundary.
Take-profit: On a test of the VAH or the previous high.
Setup 3: Trading to return to the Virgin POC
Signal: On a higher timeframe (e.g., weekly), the Virgin POC has formed.
Expectation: The price on the daily chart is moving toward this Virgin POC.
Trigger: Approaching the Virgin POC level and the appearance of support/resistance signs (slowing movement, doji, volume).
Entry: Opposite the approach direction (if the price fell toward the Virgin POC, prepare to buy on the rebound).
Stop-loss: Beyond the Virgin POC level.
Take-profit: At the nearest significant level (VAH/VAL of the adjacent profile).
Risk management and important notes:
Timeframe: First, analyze the daily (D) chart to identify key levels. Enter on a lower timeframe (H1, M15), waiting for your setup there.
Confirmation: Always look for confirmation on volume. A breakout without volume is often false.
Context: Consider the overall trend (based on the indicator’s trend lines). Setups with the trend are more reliable.
Avoid trading in the middle of the VA: This is “neutral territory” with noise and low predictability.
Don’t use the indicator in isolation: Combine it with:
Fibonacci levels (61.8% retracements often coincide with VA/POC).
Horizontal levels (previous High/Low).
Simple candlestick pattern analysis.
Bottom Line: This indicator gives you a map of the auction—where volume concentrations were and where there were “gaps.” Your goal is to trade from strong levels (POC, VA boundaries) in the direction of breakouts and the trend, always waiting for confirmation in the form of price action.


Reviews
There are no reviews yet.