Currency Pairs: Any
Timeframes: Any
Minimum Deposit: Any
Recommended Account Type: ECN or Raw Spread
Leverage: From 1:30 to 1:1000
Recommend broker: Roboforex
Recommend Vps: GoVPSFX
WaveCipherFib+ZigZag+Trend Finder is an advanced, all-in-one technical analysis tool for TradingView, developed by EnigmaWay and written in Pine Script v6. This indicator combines multiple powerful features—WaveTrend (Cipher B Divergences), ZigZag, Fibonacci Retracement/Extension, Elliott Wave analysis, and Adaptive Trend Finder—to help traders identify trends, divergences, key price levels, and potential trade setups with precision.
Key Features:
1. WaveTrend (Cipher B Divergences):
– Detects overbought/oversold conditions with customizable levels.
– Identifies regular and hidden divergences for WaveTrend, RSI, and Stochastic RSI.
– Plots buy/sell signals with visual dots and gold buy signals for high-probability setups.
– Integrates RSI, MFI, Stochastic RSI, and Schaff Trend Cycle for comprehensive momentum analysis.
2. Sommi Flag and Diamond Patterns:
– Highlights Sommi bearish/bullish flags and diamonds using higher timeframe VWAP and WaveTrend conditions.
– Provides visual markers for potential trend reversals or continuations.
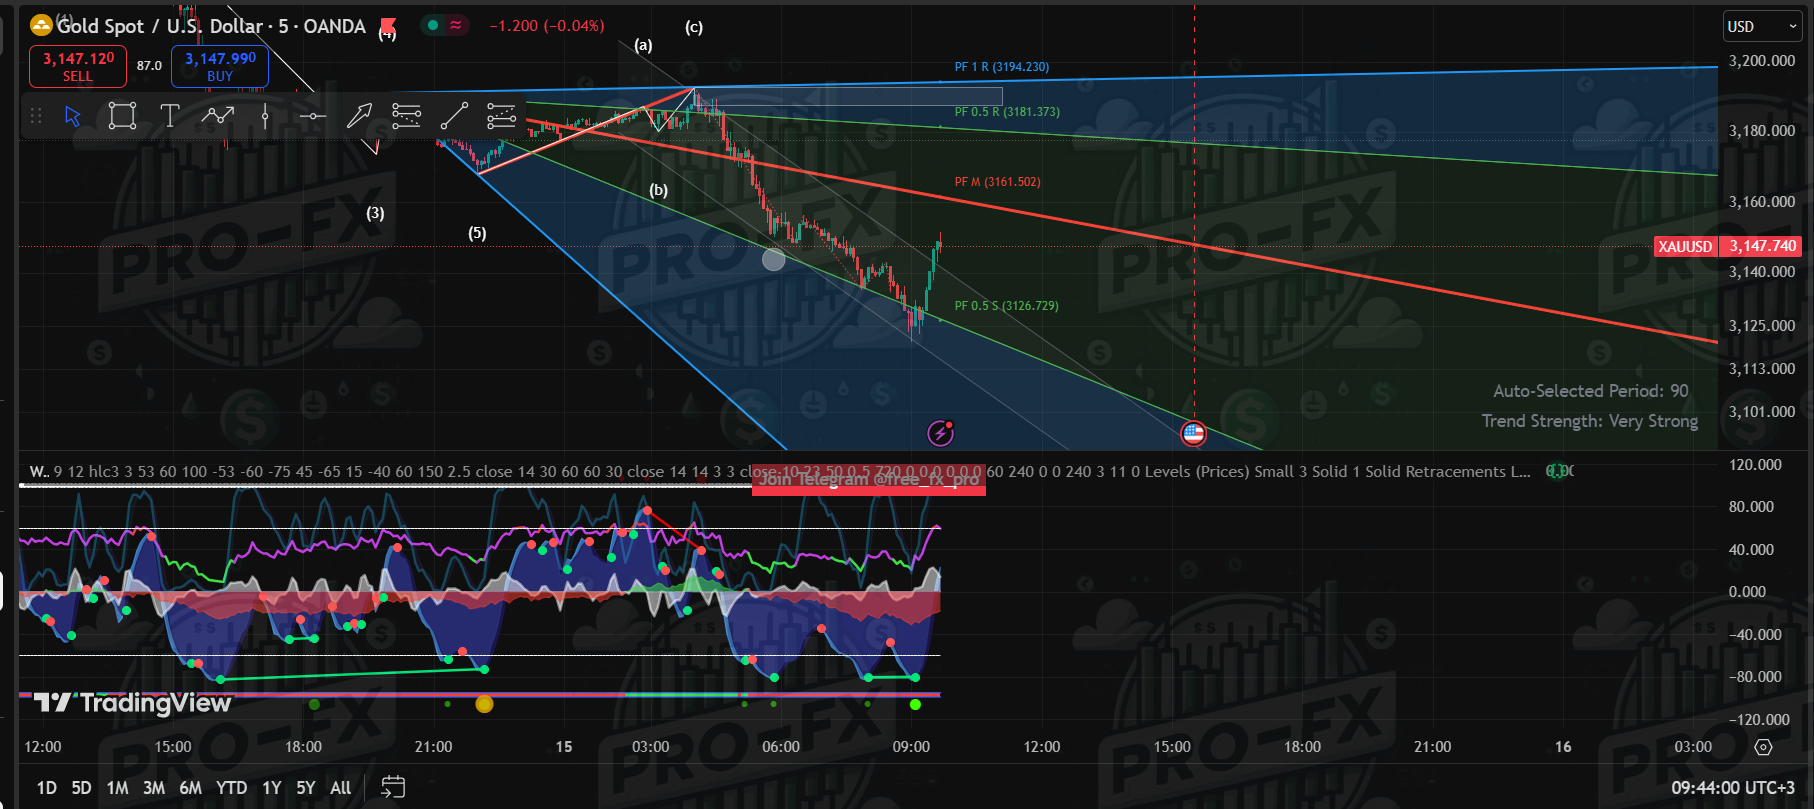
3. ZigZag with Auto PitchFan and Fibonacci Tools:
– Automatically plots ZigZag lines to identify pivot points.
– Draws Fibonacci Retracement/Extension levels and PitchFan rays to project support/resistance zones.
– Customizable Fibonacci levels (e.g., 0.236, 0.618, 1.618) and PitchFan settings for precise analysis.
4. Elliott Wave Analysis:
– Detects Elliott Wave patterns (12345 motive waves and ABC corrective waves).
– Plots wave structures with labels and Fibonacci levels to anticipate price movements.
– Alerts for new wave patterns, invalidations, and potential new wave starts.
5. Adaptive Trend Finder (Log):
– Automatically identifies the strongest trend period using Pearson’s R correlation.
– Plots trend channels with upper/lower deviations and a midline for trend direction.
– Displays trend strength, auto-selected period, and annualized return (CAGR) in a dashboard.
Visuals and Alerts:
– Visuals: Plots WaveTrend waves, divergences, ZigZag lines, Fibonacci levels, Elliott Waves, and trend channels with customizable colors, styles, and transparency.
– Alerts: Configurable alerts for buy/sell signals, divergences, Sommi patterns, Elliott Wave formations, Fibonacci level crossings, and trend channel breakouts.


Reviews
There are no reviews yet.